Español
 العربية
 Francés
 Русский
 Português
 Deutsch
 Italiano
 Polski
 Malay
Malay
 日本語
日本語
 한국어
한국어
 Nederlands
 Indonesia
 български
 Українська
 فارسی
فارسی
 اوردو
اوردو
 тоҷикӣ
 বাংলা
বাংলা






How Landscaping Companies Calculate Stand-On Mower Fleet ROI
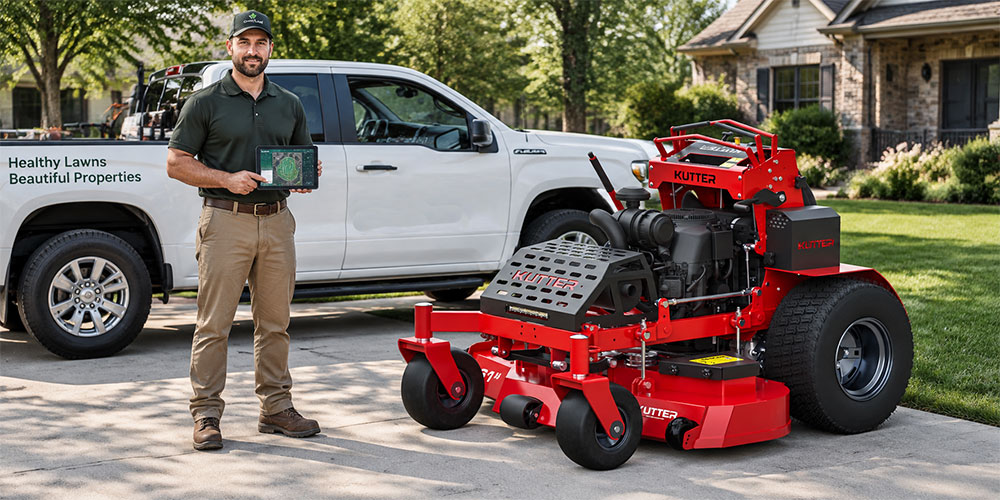
When a landscaping company adds a stand-on mower — or a whole fleet of them — the sales pitch is easy: "faster, more efficient." The financial question is harder: how fast does the machine pay for itself, and is the answer different for your routes than for the next company's? This guide builds a reusable stand-on mower fleet ROI framework from the variables that actually drive the math — acquisition cost, labor savings, acres per hour, transport capacity, maintenance, downtime and resale value. Every number in this article is a replaceable assumption; the framework is what you keep.
This is a calculation framework, not a promise of results. There is no fixed payback period that applies to all fleets, and no savings percentage that is guaranteed for every operation. Replace every assumption with your own data before making a purchase decision.
On This Page
Step 1: Define the Baseline
ROI is a comparison, so the first step is defining "before" and "after." The baseline is your current mowing method for the same acres:
| Baseline element | What to capture |
|---|---|
| Current machine type | Mower(s) doing the same work today |
| Current labor hours | Crew hours spent on the same routes |
| Current cost per hour | Labor + fuel + maintenance allocated per hour |
| Current fleet capacity | Acres per week the current setup handles |
| Current downtime | Hours lost to breakdowns and service |
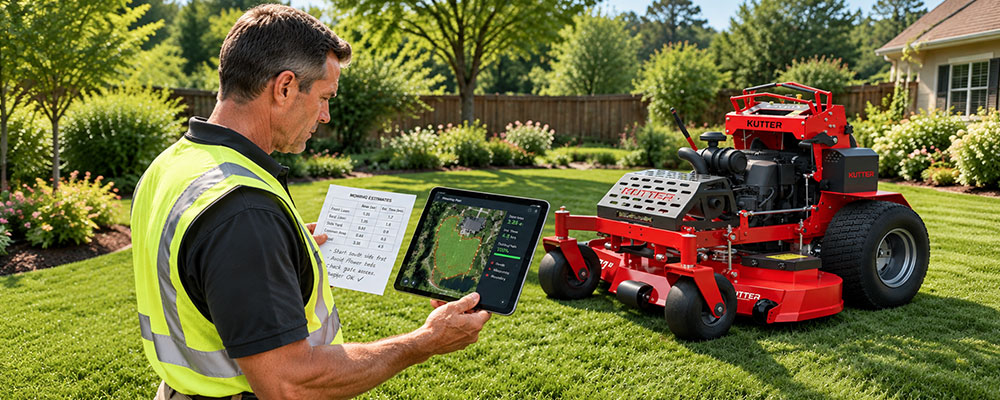
Without a baseline, every ROI calculation is guesswork. Measure or estimate the current numbers first — a week of route logging is worth more than an hour of spreadsheet work.
Step 2: Estimate Acres per Hour for the New Machine
The heart of the calculation is productivity: how many acres per hour the stand-on actually cuts on your routes. Start from the deck width and working speed, then apply a real-world efficiency factor.
| Variable | Example value | Notes |
|---|---|---|
| Deck width | 50 inches | Typical commercial stand-on |
| Theoretical max speed | 8–10 mph | Manufacturer spec |
| Realistic working speed | 5–7 mph | Obstacles, turns, gates |
| Field efficiency | 60–75% | Overlap, trim, debris, transport |
| Estimated acres/hour | 3–5 acres/hr | = width × speed × efficiency ÷ 43560 (scaled) |
Method note: A common formula is: acres per hour ≈ (deck width in inches × speed in mph × efficiency × 0.104) ÷ 1000, or you can use the full conversion. The exact formula matters less than using measured efficiency from your own routes. If your crew is 20% faster in real conditions than the brochure, use your number.
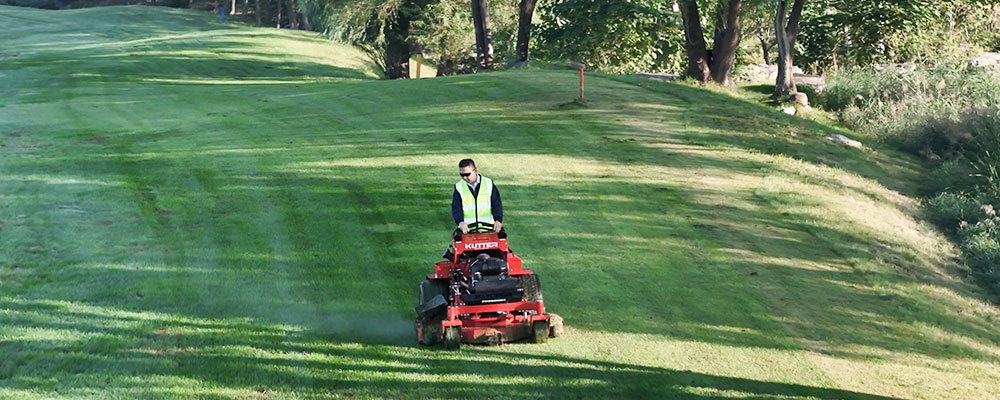
Step 3: Convert Productivity into Labor Savings
Productivity only becomes ROI when it becomes fewer labor hours or more billable acres with the same crew.
| Scenario | Before (baseline) | After (stand-on) |
|---|---|---|
| Same crew, same week | 40 crew-hours for 100 acres | 32 crew-hours for 100 acres |
| Labor savings per week | — | 8 hours × crew rate |
| Same crew, fixed hours | 100 acres in 40 hours | 125 acres in 40 hours |
| Revenue effect | — | +25% capacity, if work exists |
The second row is the classic "same acres, fewer hours" model — the savings are real dollars if the saved hours are not simply spent elsewhere. The fourth row is the "same hours, more acres" model — the value exists only if there is more billable work available to absorb the capacity. Both are legitimate; they answer different business questions.
Step 4: Build the Total Cost of Ownership (TCO)
ROI subtracts costs, so the cost side must be complete. Build a per-machine, per-year cost table:
| Cost line | What to include | Example |
|---|---|---|
| Acquisition | Purchase price minus any trade-in | $12,000–$18,000 |
| Financing | Interest over the holding period | Varies by rate/terms |
| Fuel | Gallons per week × price × weeks | Depends on hours |
| Maintenance | Oil, filters, blades, belts, service labor | ~$0.50–$1.50/hr |
| Repairs | Unexpected parts and labor | Budget a reserve |
| Transport | Trailer share, truck miles, loading time | Per route |
| Insurance | Fleet premium allocation | Per machine |
| Downtime cost | Lost billable hours when machine is down | Hidden, often largest |
| Resale value | Expected value at end of holding period | Depends on model/condition |
Downtime is the most underestimated line. A machine down for a full week in the peak season can cost more than its annual maintenance budget. Include a downtime reserve even if you have not had a breakdown yet.
Step 5: Calculate Payback and ROI
With the inputs above, the calculation is mechanical:
Weekly gross value = labor savings per week + additional billable revenue from added capacity (if realized).
Weekly net value = weekly gross value − weekly operating cost increase (fuel, maintenance) of the new machine vs. baseline.
Payback period = (acquisition + financing − expected resale) ÷ weekly net value, expressed in weeks.
Annual ROI = (annual net value − annual ownership cost) ÷ acquisition cost.
| Example (illustrative, replace with your data) | Value |
|---|---|
| Acquisition + financing | $15,000 |
| Weekly labor savings | $300 |
| Weekly added capacity value | $150 |
| Weekly operating cost increase | −$60 |
| Weekly net value | $390 |
| Weeks to payback (pre-resale) | ~38 weeks |
| Holding period | 4 years |
| Resale value | $4,000 |
| Effective payback | ~28 weeks after resale credit |
All figures above are illustrative assumptions, not quotes or guarantees. Run the same structure with your acquisition price, your labor rate, your fuel cost and your measured productivity.
Step 6: Compare Against the Alternatives
Fleet ROI is a comparison, not an absolute. Evaluate the stand-on against the realistic alternatives — keeping the current machine, buying a different deck size, or buying a second unit of the existing model:
| Alternative | Typical strengths | Typical trade-offs |
|---|---|---|
| Keep current equipment | No new capital | No productivity gain, aging fleet |
| Wider stand-on deck | More acres/hour on open turf | Higher cost, harder in tight spaces |
| Multiple mid-size units | Redundancy, flexible routing | More operators, more maintenance |
| Stand-on fleet (this model) | Speed + capacity on commercial routes | Requires route density to justify |
For fleets with varied property sizes, a 50-inch stand-on mower is often the productivity sweet spot — wide enough to move on open turf, compact enough for gated and residential accounts. Compare it against your route mix, not against a brochure.
Step 7: Monitor After Purchase
The calculation does not end at purchase. Track actuals against the model:
| Metric | Check frequency |
|---|---|
| Acres per hour (measured) | First month, then quarterly |
| Labor hours per route | Monthly |
| Fuel and maintenance cost | Monthly |
| Downtime events | Every occurrence |
| Resale value trajectory | Annually |
If measured acres/hour is below the estimate, the payback extends — and you can respond early. If it is above, the machine is earning faster than planned. Either way, actual data turns the framework into a management tool rather than a one-time estimate.
Frequently Asked Questions
What is a good payback period for a commercial mower?
There is no universal "good" number — it depends on your labor rate, route density and holding period. A common planning target is for the machine to pay back within one to two seasons, but the correct target for your company comes from your own baseline and cost structure. The framework in this article produces your number; it does not prescribe one.
How many acres per hour should a stand-on mower cut?
It depends on deck width, terrain, obstacles and operator. With a 50-inch commercial stand-on on open turf, a realistic planning range is roughly 3–5 acres per hour, and less on tight or obstacle-heavy routes. Measure your own routes rather than relying on brochure numbers.
Is a stand-on mower more profitable than a zero-turn?
Not automatically. A stand-on can cut more acres per hour on suitable routes, but profitability depends on labor cost, route density, operator skill and machine price. Run the comparison on your routes with your numbers — the more productive machine wins only if the capacity is actually used.
What are the biggest hidden costs in mower fleet ROI?
Downtime in peak season, transport and loading time, blade and belt wear, and the cost of financed capital. Companies that only compare purchase prices miss the downtime line, which is often the largest cost in a busy season.
How do I estimate the resale value of a stand-on mower?
Resale depends on model, hours, condition and local demand. A practical approach: plan a conservative resale figure (for example, a percentage of original price after a defined holding period), then verify against your local used market when you are close to selling. Do not count on the best-case resale to justify the purchase.
How should I size a stand-on fleet for my company?
Size the fleet to the route mix and the crew, not to a single machine. Match deck width to the properties you serve — wider for open turf, mid-size for mixed routes — and keep enough machines for peak weeks. Use the ROI framework to compare fleet sizes before buying. Review the stand-on mower range and speak with a KUTTER sales representative to align machine choice with your route data.
Bottom Line
Stand-on mower fleet ROI is not a single number — it is a framework built from your baseline, your productivity and your costs. Replace every assumption in this article with your own data, track actuals after purchase, and treat the calculation as a living management tool rather than a one-time justification.

Need Help Building Your Fleet ROI Model?
We will send you a customizable spreadsheet and fleet-matching guidance based on your routes — no obligation.
Contact Us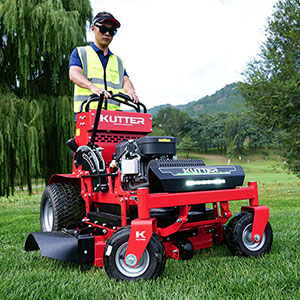
Related Products

ZTS-36B
hot selling index
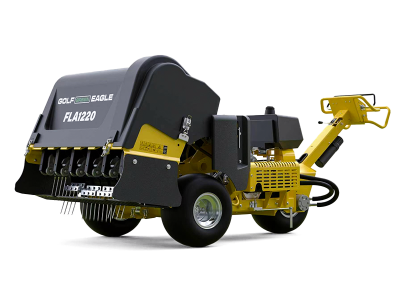
FLA 1220
hot selling index
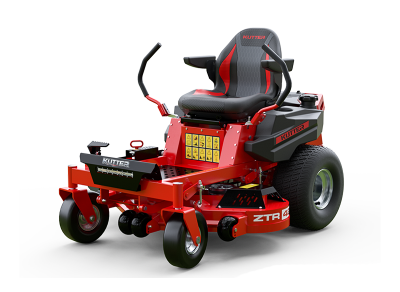
ZTR-36B
hot selling index